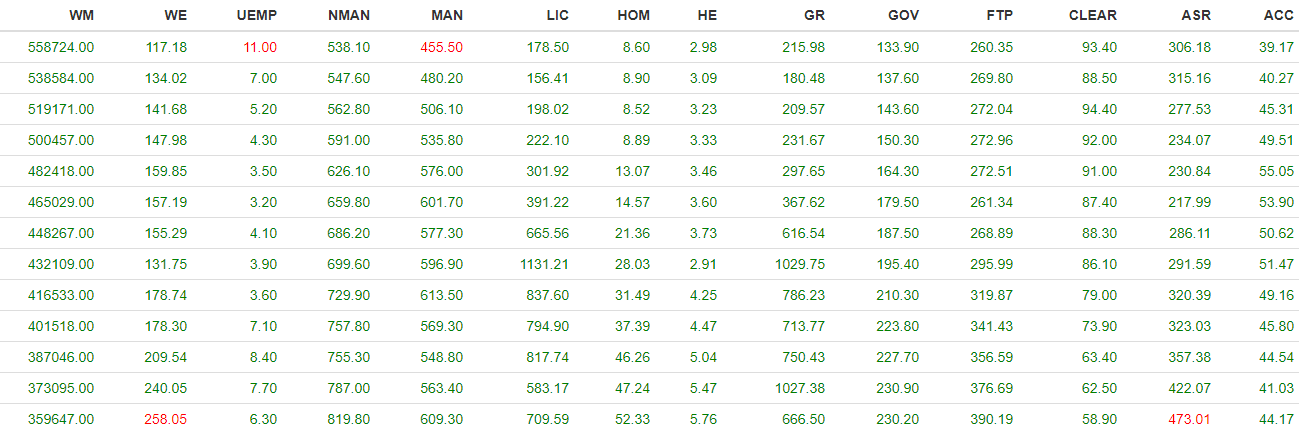
The outlier(s) will be highlighted in red.
Usage
routlier_formattable(data,sd)
Arguments
- data
filepath to data.
- sd
number of standard deviations to check the data against.
Value
Returns an outlier dataset from the original dataset in a DT table
Examples
  routlier_formattable(data = detroit,sd = 2)
#> You have  4  outliers in your dataset
#>  [1] "WM"    "WE"    "UEMP"  "NMAN"  "MAN"   "LIC"   "HOM"   "HE"    "GR"
#> [10] "GOV"   "FTP"   "CLEAR" "ASR"   "ACC"
#>  [1] "WM"    "WE"    "UEMP"  "NMAN"  "MAN"   "LIC"   "HOM"   "HE"    "GR"
#> [10] "GOV"   "FTP"   "CLEAR" "ASR"   "ACC"