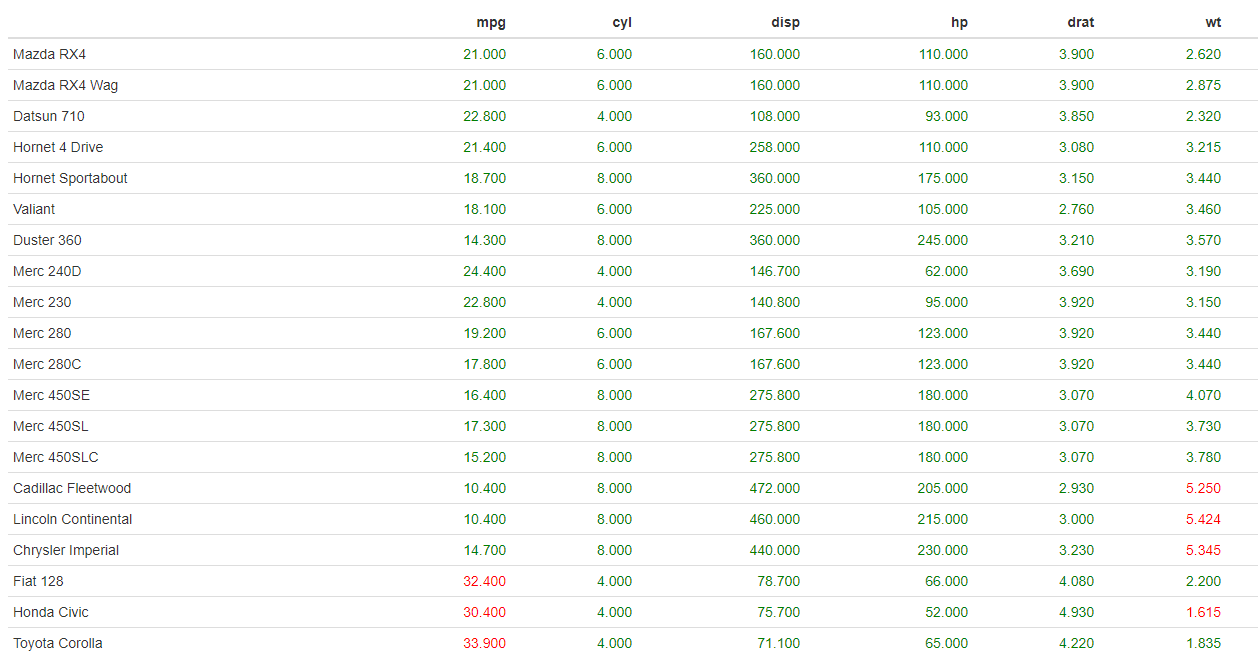
Returns an outlier data frame in a DT table utilizing the mean absolute deviation (MAD) method
Source:R/routlier_mad.R
routlier_mad.RdThe Outlier(s) wil be highlighted red in the table and the other values will be highlighted greeen.

There is also a printout of the data and the columns giving the upper and lower MAD and the overall range of the MAD.

Value
Returns a numeric dataset from the original dataset and the outliers are highlighted in red.The outlier table and the number of outliers are returned as a list object.
Examples
  data<- routlier_mad(data = mtcars,MAD = 2)
#> [1] "The MAD for column 1 is from: 30.02298 : 8.37702 and the overall MAD range is: 21.64596"
#> [1] "The MAD for column 2 is from: 11.9304 : 0.0696000000000003 and the overall MAD range is: 11.8608"
#> [1] "The MAD for column 3 is from: 477.2527 : -84.6527 and the overall MAD range is: 561.9054"
#> [1] "The MAD for column 4 is from: 277.1904 : -31.1904 and the overall MAD range is: 308.3808"
#> [1] "The MAD for column 5 is from: 5.10347 : 2.28653 and the overall MAD range is: 2.81694"
#> [1] "The MAD for column 6 is from: 4.859491 : 1.790509 and the overall MAD range is: 3.068982"
#> [1] "The MAD for column 7 is from: 20.541766 : 14.878234 and the overall MAD range is: 5.663532"
#> [1] "The MAD for column 8 is from: 0 : 0 and the overall MAD range is: 0"
#> [1] "The MAD for column 9 is from: 0 : 0 and the overall MAD range is: 0"
#> [1] "The MAD for column 10 is from: 6.9652 : 1.0348 and the overall MAD range is: 5.9304"
#> [1] "The MAD for column 11 is from: 4.9652 : -0.9652 and the overall MAD range is: 5.9304"
#> [1] "You have a total of 15 Outliers in your dataset"

  print(data$outliers)
#> [1] 15