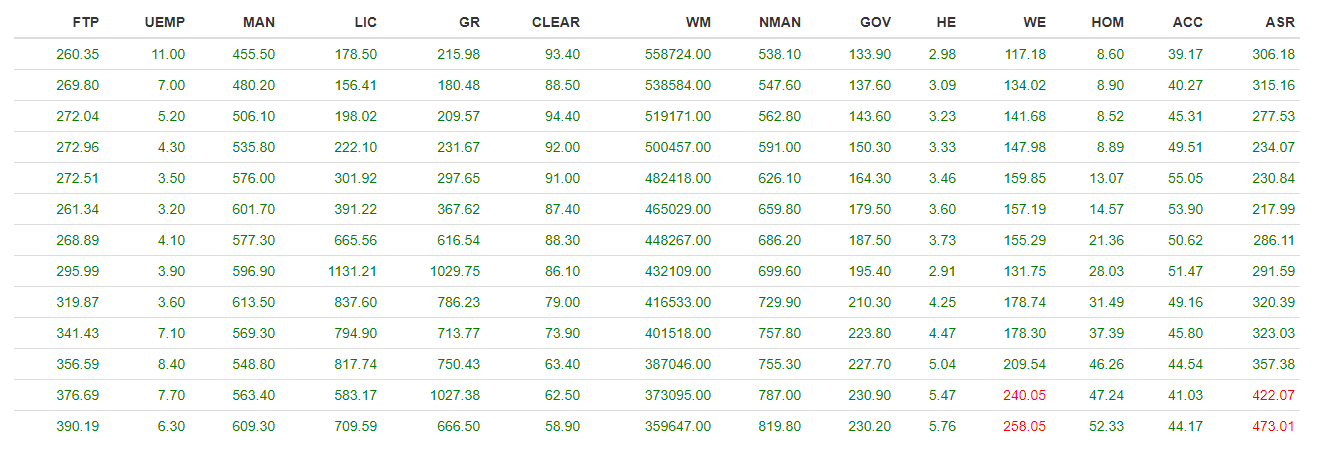
Returns a formattable data frame that highlights the outliers utilizing the quantile method.
Source:R/routlier_quantile.R
routlier_quantile.RdThe word 'Outlier' will replace the value that is an outlier in the respective cell.
Arguments
- data
filepath to data
- type
select type of quantile method to use. Choices from 1 to 7.
- outlier_type
select type of outlier selecting either "M" for mild or "E" for extreme.
Value
Return's an outlier dataset from the original dataset in a formattable table. The data returned is currently the numeric data only from the dataset.
Examples
## Load the routlier library
   library(routlier)

## Look at outliers utilizng the Tukey method
  routlier_quantile(data = iris,type = 7,outlier_type="M")
#> [1] "The IQR for column 1 is from: 8.35 : 3.15 and the overall IQR range is: 5.2"
#> [1] "The IQR for column 2 is from: 4.05 : 2.05 and the overall IQR range is: 2"
#> [1] "The IQR for column 3 is from: 10.35 : -3.65 and the overall IQR range is: 14"
#> [1] "The IQR for column 4 is from: 4.05 : -1.95 and the overall IQR range is: 6"
#> [1] "You have a total of 4 Outliers in your dataset"